Visual extra
- Package name: visual
- Visual: Target gauge Total
- Visual: Target gauge Step
- Canvas: Freehand
- Canvas: Marking
- Sliderbar
- SQL: Diagram query
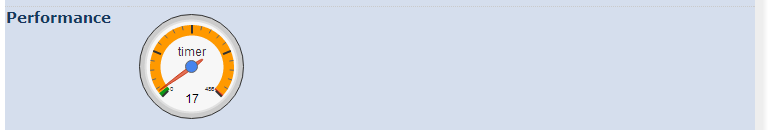
Visual: Target gauge Total
Show lifetime performance speedometer
Properties
- Type: Visual extra
- Groupable: No
- Show in lists: No
- Searchable: No
User interface
Field in show mode

Due to its nature this field has no special editing mode.
Configuration
This field does not need deployment (no ekstra database fields required).
No configuration required for this field type
Developer info
- FeltTypeID: 810
- SQL datatype: N/A
- Class name: FieldGaugePerformance
Visual: Target gauge Step
Show performance speedometer for this step
Properties
- Type: Visual extra
- Groupable: No
- Show in lists: No
- Searchable: No
User interface
Field in show mode
Due to its nature this field has no special editing mode.
Configuration
This field does not need deployment (no ekstra database fields required).
No configuration required for this field type
Developer info
- FeltTypeID: 811
- SQL datatype: N/A
- Class name: FieldGaugePerformanceStep
Canvas: Freehand
Draw, freehand, in a canvas
Properties
- Type: Visual extra
- Groupable: [YES/NO]
- Show in lists: [YES/NO]
- Searchable: [YES/NO]
User interface
Field in show mode
[INSERT IMAGE]
Field in edit mode
[INSERT IMAGE]
Configuration
[INSERT IMAGE]
[Description of configs]
Developer info
- FeltTypeID: 812
- SQL datatype: MEDIUMTEXT
- Class name: FieldCanvasDrawing
Canvas: Marking
Mark a spot on an image
Properties
- Type: Visual extra
- Groupable: [YES/NO]
- Show in lists: [YES/NO]
- Searchable: [YES/NO]
User interface
Field in show mode
[INSERT IMAGE]
Field in edit mode
[INSERT IMAGE]
Configuration
[INSERT IMAGE]
[Description of configs]
Developer info
- FeltTypeID: 813
- SQL datatype: TINYTEXT
- Class name: FieldCanvasMarking
Sliderbar
Numbers with decimal comma using a sliderbar for input
Properties
- Type: Visual extra
- Groupable: No
- Show in lists: Yes
- Searchable: Yes
- Requires configuration: [Yes/no]
User interface
Field in show mode

Field in edit mode

Configuration

Required:
- Minimal value
- Maximum value
Options:
- Making the slider display vertically
- orientation: "vertical",
- Using steps i the slider
- step: 10,
- JSON configuration notes: [1]
Developer info
- FeltTypeID: 911
- SQL datatype: DECIMAL(20,6)
- Class name: FieldSliderBarDecimal
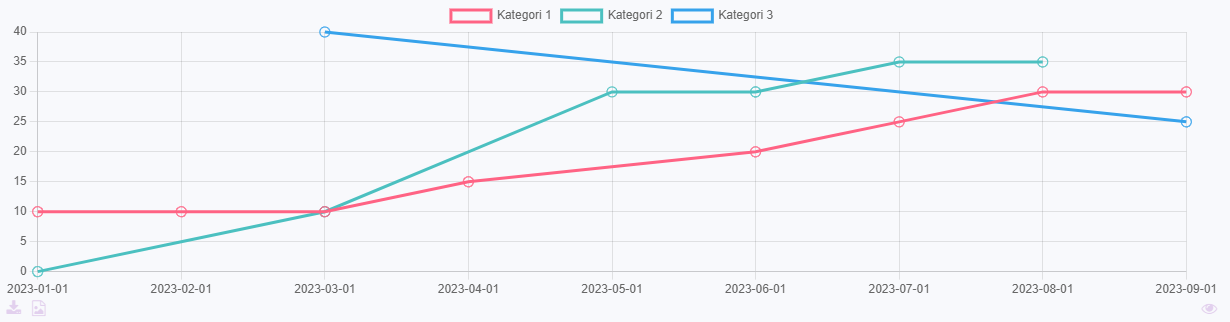
SQL: Diagram query
Shows an sql-query as a graph, just like the dashboard widget, with the same configs as the sql-subselect field.
Properties
- Type: Visual extra
- Groupable: No
- Show in lists: No
- Searchable: No
- Requires configuration: Yes
User interface
Field in show mode, when rendering a line-chart.
Due to its nature this field has no special editing mode.
Configuration
[INSERT IMAGE]
Either, write an sql-query that fetches the exact data to be shown, as described here.
Or, write a simple sql-query that fetches the lines of data and select render-mode "Parse listed data".
Select a graph type, remember that the expected structure of the data is different for circle- and xy-graphs.
Parse listed data
This option parses the given data in the following way.
- Column 1 will be used as x-axis values.
- Column 2 will be used for datasets in the graph.
- Column 3 will be used for y-axis values.
Example
This is data generated by the query: SELECT DATE, CATEGORY, AMOUNT FROM data_demoentity ORDER BY DATE ASC
| Date | Category | Amount |
|---|---|---|
| 01/01/2024 | Category 1 | 10 |
| 01/01/2024 | Category 2 | 0 |
| 01/01/2024 | Category 3 | 15 |
| 01/02/2024 | Category 1 | 20 |
| 01/03/2024 | Category 2 | 20 |
| 01/04/2024 | Category 1 | 30 |
| 01/04/2024 | Category 2 | 10 |
| 01/04/2024 | Category 3 | 15 |
This will be transformed to this, when rendering an xy-graph.
| Title | Category 1 | Category 2 | Category 3 |
|---|---|---|---|
| 01/01/2024 | 10 | 0 | 15 |
| 01/02/2024 | 20 | ||
| 01/03/2024 | 20 | ||
| 01/04/2024 | 30 | 10 | 15 |
Developer info
- FeltTypeID: 530
- SQL datatype: N/A
- Class name: FieldSubselectDiagram