# SQL: Diagram query
Shows an sql-query as a graph, just like the [dashboard widget](https://docs.tsnocode.com/books/dashboards/chapter/diagram-widget-configuration "Dashboard diagram widget configuration"), with the same configs as the [sql-subselect field](https://docs.tsnocode.com/books/field-type-reference/page/sql-subselect "FieldSubselect").
### Properties
- Type: [Visual extra](https://docs.tsnocode.com/books/field-type-reference/chapter/visual-extra)
- Groupable: No
- Show in lists: No
- Searchable: No
- Requires configuration: Yes
## User interface
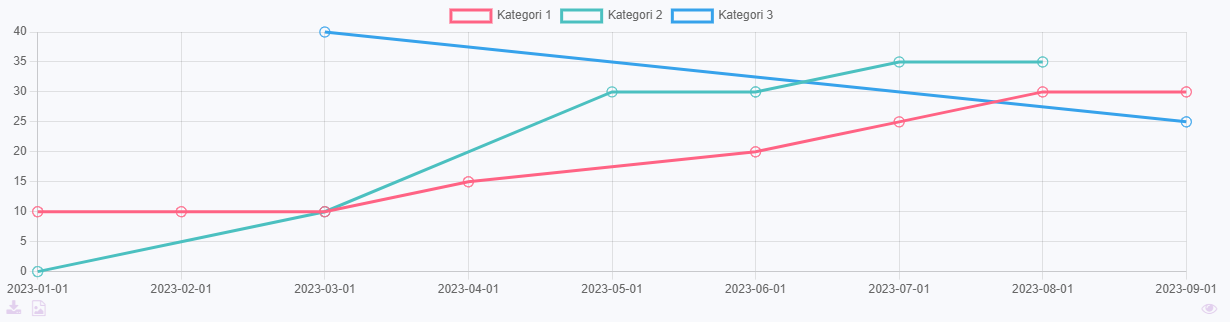
Field in show mode, when rendering a line-chart.
[](https://docs.tsnocode.com/uploads/images/gallery/2025-07/bD5lWyykTBGLAbwL-image.png)
Due to its nature this field has no special editing mode.
## Configuration
\[INSERT IMAGE\]
Either, write an sql-query that fetches the exact data to be shown, as described here.
Or, write a simple sql-query that fetches the lines of data and select render-mode "Parse listed data".
Select a graph type, remember that the expected structure of the data is different for circle- and xy-graphs.
### Parse listed data
This option parses the given data in the following way.
- Column 1 will be used as x-axis values.
- Column 2 will be used for datasets in the graph.
- Column 3 will be used for y-axis values.
#### Example
This is data generated by the query: `SELECT DATE, CATEGORY, AMOUNT FROM data_demoentity ORDER BY DATE ASC`
| Date | Category | Amount |
|---|
| 01/01/2024 | Category 1 | 10 |
| 01/01/2024 | Category 2 | 0 |
| 01/01/2024 | Category 3 | 15 |
| 01/02/2024 | Category 1 | 20 |
| 01/03/2024 | Category 2 | 20 |
| 01/04/2024 | Category 1 | 30 |
| 01/04/2024 | Category 2 | 10 |
| 01/04/2024 | Category 3 | 15 |
This will be transformed to this, when rendering an xy-graph.
| Title | Category 1 | Category 2 | Category 3 |
|---|
| 01/01/2024 | 10 | 0 | 15 |
| 01/02/2024 | 20 | | |
| 01/03/2024 | | 20 | |
| 01/04/2024 | 30 | 10 | 15 |
## Developer info
- FeltTypeID: 530
- SQL datatype: N/A
- Class name: FieldSubselectDiagram